This is the second part in a series of three that explains how you can add series to Silverlight Charts. We'll look at how Silverlight Chart's rich hierarchy of interfaces allow developers to create series that can play well with all the built-in series and axes, as well as custom series and axes written by other parties. Once again...
Beware: Silverlight charts is still in preview mode and there may be breaking changes in the future despite our best efforts to avoid them.
Last time we learn how to structure our series in such a way that designers can customize its appearance. Now we can get down to the business of implementing our stock series. The StockSeries class is responsible for the following:
- Acquiring a data point style
- Adding a legend item
- Binding data points to a data source
- Acquiring axes
- Plotting the Data Points
Acquiring a Data Point Style
When we plot multiple series in the same Chart we want each of them to have different colors so that we can tell them apart.
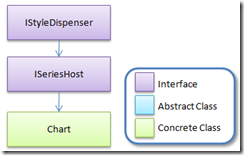
To ensure that our StockSeries uses a different color than the other series in the chart it must retrieve the next available style from its series host. A series host contains series and provides them with various services. Currently the only object that implements the ISeriesHost interface in Silverlight Charts is the Chart object. Let's take a look at the Chart hierarchy.
When a series is inserted into a Chart the SeriesHost property of the series is set to that Chart. Conversely when a series is removed from a chart its SeriesHost property is set to null. When the SeriesHost property changes a protected method OnSeriesHostPropertyChanged is invoked. We can override this method in our StockSeries class if we want to do something when the series is added or removed from a Chart.
We should acquire a style from our series host when...
1. The series host changes
2. The RefreshStyles method of the base "Series" class is called
    public class StockSeries : Series, IRequireGlobalSeriesIndex
    {
        private Style DataPointStyle { get; set; }

        protected override void OnSeriesHostPropertyChanged(ISeriesHost oldValue, ISeriesHost newValue)
        {
            AcquireDataPointStyle();
            base.OnSeriesHostPropertyChanged(oldValue, newValue);
        }

        public override void RefreshStyles()
        {
            AcquireDataPointStyle();
            Refresh();
        }
        private void AcquireDataPointStyle()
        {
            if (SeriesHost != null)
            {
                using (IEnumerator<Style> styleEnumerator = SeriesHost.GetStylesWithTargetType(typeof(StockDataPoint), true))
                {
                    if (styleEnumerator.MoveNext())
                    {
                        DataPointStyle = styleEnumerator.Current;
                    }
                }
            }
        }

        // snip...
    }
In the example above we're using the IStyleDispenser's extension method GetStylesWithTargetType (in System.Windows.Controls.DataVisualization) to retrieve an IEnumerator of styles appropriate for our data point type.
newValue.GetStylesWithTargetType(typeof(StockDataPoint), true))
The "true" indicates that we are willing to accept styles with a target type that is an ancestor of our data point's type. Due to the fact that all of the styles in the Chart's default style palette target Control - which StockDataPoint inherits from - we can be sure our series will get a style when we insert it into a Chart.
Adding a Legend Item
Now that we've acquired a style we can use for our data points the time is right to insert a legend item into the Legend. We'll add a private property to store an instance of the LegendItem class and initialize it in the constructor. In order to ensure that it is inserted into the Legend we'll add it to the series LegendItems collection (inherited from base class Series). UI elements inserted into the legend items collection of a series are automatically inserted into the legend by the series host.
    public class StockSeries : Series
    {
        // snip...

        private LegendItem LegendItem { get; set; }

        public StockSeries()
        {
            this.DefaultStyleKey = typeof(StockSeries);
            this.LegendItem = new LegendItem();
            this.LegendItems.Add(LegendItem);
        }

    }
A well-behaved series ensures the following:
- If it does not have a title its legend item should display the series index
- If it has a title the legend item should display it
- Its legend item should have a visual appearance similar to its data points
Displaying the Series Index
If the series does not have a title it should display its series index in the LegendItem. Therefore we must determine what the index of our series is. We can try and figure out our index by counting the series in our series host collection, but this approach is complicated because we would also have to monitor the series collection of our series host for any changes.
Thankfully we can let the series host do the work for us by implementing IRequireGlobalSeriesIndex. This is our way of signaling to the series host that this series uses an index and needs to be informed when that index changes. In addition to implementing this interface we'll also add a property to store the global series index value.
    public class StockSeries : Series, IRequireGlobalSeriesIndex
    {
        private int GlobalSeriesIndex { get; set; }

        private LegendItem LegendItem { get; set; }

        public void GlobalSeriesIndexChanged(int globalIndex)
        {
            GlobalSeriesIndex = globalIndex;
            UpdateLegendItem();
        }

        private void UpdateLegendItem()
        {
            if (GlobalSeriesIndex != -1)
            {
                LegendItem.Content = string.Format("Series {0}", GlobalSeriesIndex + 1);
            }
        }

        // snip...
    }
Now if we add our series to a chart we should be able to see our legend item!

Displaying the Series Title in the Legend Item
If a series title is set it's good practice to display it in the legend item instead of the index. We could set the content of our legend item to the series Title property when we create the legend item, but we also need to update our legend item if the title changes. We can listen for changes to the title property by overriding the protected OnTitleChanged method. Let's also modify our private UpdateLegendItem method to check if the Title property is set before resorting to using the series index.
    public class StockSeries : Series, IRequireGlobalSeriesIndex
    {
        private void UpdateLegendItem()
        {
            if (Title != null)
            {
                LegendItem.Content = this.Title;
            }
            else if (GlobalSeriesIndex != -1)
            {
                LegendItem.Content = string.Format("Series {0}", GlobalSeriesIndex+1);
            }
        }

        protected override void OnTitleChanged(object oldValue, object newValue)
        {
            UpdateLegendItem();
            base.OnTitleChanged(oldValue, newValue);
        }

        // snip...
    }
Now if we specify a custom series title we can see it in the Legend!
        <charting:Chart>
            <local:StockSeries Title="My First Series" />
        </charting:Chart>

Styling the Legend Item
Ideally we'd like our legend item to be the same color as our data points. We can accomplish this by creating an instance of StockSeriesDataPoint, applying the data point style we retrieved from the series host, and setting the data point to be the data context of our legend item. The best place to do this is in our AcquireDataPointStyle method.
private void AcquireDataPointStyle()
{
    if (SeriesHost != null)
    {
        using (IEnumerator<Style> styleEnumerator = SeriesHost.GetStylesWithTargetType(typeof(StockDataPoint), true))
        {
            if (styleEnumerator.MoveNext())
            {
                DataPointStyle = styleEnumerator.Current;
                this.LegendItem.DataContext = new StockDataPoint { Style = DataPointStyle };
            }
        }
    }
}
Now we can see that the legend item has a color.

So how does this work? The default template for the LegendItem binds to the background color and border brush properties of its DataContext. This approach means that we can expose a LegendItemStyle property and give designers the ability to replace our legend item's template while still retaining certain aspects of the data point style (such as the color). I'll leave that as an exercise for the reader.
Binding Data Points to a Data Source
We'd like to be able to bind our series directly to objects in our data source. Let's add string properties for the DatePath, HighPath, LowPath, and ClosePath to our series. We'll store the path's in binding objects which we'll use to bind the properties in our data points to the properties in our data source objects. We expose string properties for our paths instead of bindings because strings are easier to work with in Blend.
        private Binding dateBinding = new Binding();

        public string DateBinding
        {
            get
            {
                return dateBinding.Path.Path;
            }
            set
            {
                dateBinding.Path = new PropertyPath(value);
            }
        }

        private Binding lowBinding = new Binding();

        public string LowPath
        {
            get
            {
                return lowBinding.Path.Path;
            }
            set
            {
                lowBinding.Path = new PropertyPath(value);
            }
        }

        private Binding highBinding = new Binding();

        public string HighPath
        {
            get
            {
                return highBinding.Path.Path;
            }
            set
            {
                highBinding.Path = new PropertyPath(value);
            }
        }

        private Binding closeBinding = new Binding();

        public string ClosePath
        {
            get
            {
                return closeBinding.Path.Path;
            }
            set
            {
                closeBinding.Path = new PropertyPath(value);
            }
        }
Let's follow the ItemsControl model and add an ItemsSource dependency property of type IEnumerable. When the ItemsSource property changes we'll create a data point for each object and add the data points to a dictionary using the object as the key. We'll use a helper method called CreateStockDataPoint to create the data point, apply our data point style, and add the bindings to it.
        private StockDataPoint CreateStockDataPoint(object value)
        {
            var stockDataPoint = new StockDataPoint { DataContext = value };
            stockDataPoint.Style = DataPointStyle;
            stockDataPoint.SetBinding(StockDataPoint.DateProperty, dateBinding);
            stockDataPoint.SetBinding(StockDataPoint.HighProperty, highBinding);
            stockDataPoint.SetBinding(StockDataPoint.LowProperty, lowBinding);
            stockDataPoint.SetBinding(StockDataPoint.CloseProperty, closeBinding);
            return stockDataPoint;
        }

        private Dictionary<object, StockDataPoint> _dataPoints = new Dictionary<object, StockDataPoint>();

        public IEnumerable ItemsSource
        {
            get { return GetValue(ItemsSourceProperty) as IEnumerable; }
            set { SetValue(ItemsSourceProperty, value); }
        }

        public static readonly DependencyProperty ItemsSourceProperty =
            DependencyProperty.Register(
                "ItemsSource",
                typeof(IEnumerable),
                typeof(StockSeries),
                new PropertyMetadata(null, OnItemsSourcePropertyChanged));

        private static void OnItemsSourcePropertyChanged(DependencyObject d, DependencyPropertyChangedEventArgs e)
        {
            StockSeries source = (StockSeries)d;
            IEnumerable oldValue = (IEnumerable)e.OldValue;
            IEnumerable newValue = (IEnumerable)e.NewValue;
            source.OnItemsSourcePropertyChanged(oldValue, newValue);
        }

        protected virtual void OnItemsSourcePropertyChanged(IEnumerable oldValue, IEnumerable newValue)
        {
            Refresh();
        }

        public override void Refresh()
        {
            if (ItemsSource != null)
            {
                this.PlotArea.Children.Clear();
                _dataPoints =
                    ItemsSource
                        .Cast<object>()
                        .Select(obj => CreateStockDataPoint(obj))
                        .ToDictionary(dataPoint => dataPoint.DataContext);
                foreach (StockDataPoint dataPoint in _dataPoints.Values)
                {
                    this.PlotArea.Children.Add(dataPoint);
                }
            }
        }
That's all it takes to create our data points and bind them to an underlying data source!
Creating Some Sample Data To Plot
We'll need some sample data if we want to see our series in action. First we'll need a class to hold our sample data.
        public class HighLowClose
        {
            public DateTime Date { get; set; }

            public double High { get; set; }

            public double Low { get; set; }

            public double Close { get; set; }
        }
That was easy. Thanks automatic properties! Now let's create a set of data and set it to the ItemsSource property of our series.
            var date = new DateTime(2008, 1, 1);
            StockSeries stockSeries = chart.Series[0] as StockSeries;
            stockSeries.DatePath = "Date";
            stockSeries.HighPath = "High";
            stockSeries.LowPath = "Low";
            stockSeries.ClosePath = "Close";
            stockSeries.ItemsSource =
                new[]
                {
                    new HighLowClose
                    {
                        Date = date,
                        High = 23.0,
                        Low = 18.0,
                        Close = 22.0
                    },
                    new HighLowClose
                    {
                        Date = date.AddDays(1),
                        High = 26.0,
                        Low = 22.0,
                        Close = 22.0
                    },
                    new HighLowClose
                    {
                        Date = date.AddDays(2),
                        High = 33.0,
                        Low = 30.0,
                        Close = 32.0
                    },
                    new HighLowClose
                    {
                        Date = date.AddDays(3),
                        High = 44.0,
                        Low = 42.0,
                        Close = 43.0
                    },
                    new HighLowClose
                    {
                        Date = date.AddDays(4),
                        High = 37.0,
                        Low = 35.0,
                        Close = 36.0
                    },
                    new HighLowClose
                    {
                        Date = date.AddDays(5),
                        High = 49.0,
                        Low = 43.0,
                        Close = 48.0
                    },
                };
Now we're ready to starting plotting our data points.
Acquiring Axes
Listening for Changes
To plot our data points we'll need axes, but first we need to ensure that our series can receive messages from them. The series needs to be able to listen for changes in the axes such as a change in the range or size. This way it can respond to these changes by updating the positions of its data points accordingly. A series can listen for axis changes by implementing the IAxisListener interface.
    [TemplatePart(Name = "PlotArea", Type = typeof(Canvas))]
    public class StockSeries : Series, IAxisListener, IRequireGlobalSeriesIndex
    {
        // snip...

        public void AxisInvalidated(IAxis axis)
        {
        }
    }
The AxisInvalidated method is called by an axis when it changes. Eventually we will add some code to update our data points to this method. For the time being we'll leave it empty though.
Acquiring Axes
Now that we can listen for changes in an axis we want to acquire axes that we can use. Where do get them from though?
A well-behaved series does the following when it is added to a series host:
- Looks for suitable axes in its series host's axes collection
- If no axes are found it creates the axes it needs and adds them to its series host's collection of axes
- Adds itself to each axes' collection of registered listeners
A well-behaved series does the following when it is removed from a series host:
- Removes itself from each axes' collection of registered listeners
If we follow the steps above our stock series can share the same axes with other series. We will also ensure that developers won't have to explicitly add appropriate axes to the chart's axes collection before they can use our series.
There are three axes available in Silverlight Charts:
- LinearAxis
- DateTimeAxis
- CategoryAxis
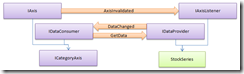
One approach would be too look for a horizontal DateTimeAxis and a vertical LinearAxis in the series host's axes collection when the SeriesHost property changes. While this approach would work it would be sub-optimal. In addition to allowing custom series, Silverlight Charts also allows custom axes. We'd like our series to be able to use any axes added in the future (ex. LogarithmicAxis) as well as axes added by third-parties. Let's take a look at the axis hierarchy.

You might be feeling a little overwhelmed but don't worry :-). We're primarily interested in the interfaces and I'll explain those one by one.
Let's take a look at the axes acquisition code in our StockSeries class.
private IAxis IndependentAxis { get; set; }

private IRangeAxis DependentAxis { get; set; }

protected override void OnSeriesHostPropertyChanged(ISeriesHost oldValue, ISeriesHost newValue)
{
    if (newValue != null)
    {
        this.IndependentAxis =
            newValue.Axes
                .OfType<IAxis>()
                .Where(axis => axis.CanPlot(DateTime.Now) && axis.Orientation == AxisOrientation.X)
                .FirstOrDefault();

        if (this.IndependentAxis == null)
        {
            IndependentAxis = new DateTimeAxis { Orientation = AxisOrientation.X };
            newValue.Axes.Add(IndependentAxis);
        }

        this.IndependentAxis.RegisteredListeners.Add(this);

        this.DependentAxis =
            newValue.Axes
                .OfType<IRangeAxis>()
                .Where(rangeAxis => rangeAxis.CanPlot(0.0) && rangeAxis.Orientation == AxisOrientation.Y)
                .FirstOrDefault();

        if (this.DependentAxis == null)
        {
            DependentAxis = new LinearAxis { Orientation = AxisOrientation.Y };
            newValue.Axes.Add(DependentAxis);
        }

        this.DependentAxis.RegisteredListeners.Add(this);
    }
    else
    {
        if (this.IndependentAxis != null)
        {
            this.IndependentAxis.RegisteredListeners.Remove(this);
        }

        if (this.DependentAxis != null)
        {
            this.DependentAxis.RegisteredListeners.Remove(this);
        }
    }
    AcquireDataPointStyle();
    base.OnSeriesHostPropertyChanged(oldValue, newValue);
}
One immediate side-effect of this general approach is that we can use a CategoryAxis on the horizontal in addition to a DateTimeAxis because category axes can plot dates as well.
When we acquire an axis we add ourselves to its registered listeners collection. When the axis changes it will call the AxisInvalidated method on all its registered and we'll get the opportunity to update our data points. Now we're ready for the main event...
Plotting the Data Points
When the "Refresh" method of the base Series class is called our series is expected to retrieve data from its data source and plot its data points. Let's create an "UpdateDataPoints" method which will plot a sequence of data points and invoke it in the "Refresh" method.
        public override void Refresh()
        {
            if (IndependentAxis != null && DependentAxis != null && PlotArea != null && ItemsSource != null)
            {
                this.PlotArea.Children.Clear();
                _dataPoints =
                    ItemsSource
                        .Cast<object>()
                        .Select(obj => CreateStockDataPoint(obj))
                        .ToDictionary(dataPoint => dataPoint.DataContext);
                foreach (StockDataPoint dataPoint in _dataPoints.Values)
                {
                    this.PlotArea.Children.Add(dataPoint);
                }

                this.Dispatcher.BeginInvoke(() => UpdateDataPoints(_dataPoints.Values));
            }
        }
Notice that instead of updating the data points synchronously we use BeginInvoke. This will delay the process until after a layout pass has occurred. This gives Silverlight/WPF the opportunity to apply the template to our data point controls. This is important as we will need to know the final width of the data points in order to center them along the X axis. Now let's write the methods that do the important work of positioning the data points.
private void UpdateDataPoints(IEnumerable<StockDataPoint> dataPoints)
{
    foreach (var dataPoint in dataPoints)
    {
        UpdateDataPoint(dataPoint);
    }
}

private void UpdateDataPoint(StockDataPoint dataPoint)
{
    // GetPlotAreaCoordinate returns a nullable value because the value
    // may or may not be present on the axis.
    var dateCoordinateUnitValue = IndependentAxis.GetPlotAreaCoordinate(dataPoint.Date);
    if (dateCoordinateUnitValue != null && dateCoordinateUnitValue.Value.Unit == Unit.Pixels)
    {

        var nullableHighCoordinateUnitValue = DependentAxis.GetPlotAreaCoordinate(dataPoint.High);
        var nullableLowCoordinateUnitValue = DependentAxis.GetPlotAreaCoordinate(dataPoint.Low);
        var nullableCloseCoordinateUnitValue = DependentAxis.GetPlotAreaCoordinate(dataPoint.Close);

        if (nullableHighCoordinateUnitValue != null && nullableHighCoordinateUnitValue.Value.Unit == Unit.Pixels
            && nullableLowCoordinateUnitValue != null && nullableLowCoordinateUnitValue.Value.Unit == Unit.Pixels
            && nullableCloseCoordinateUnitValue != null && nullableCloseCoordinateUnitValue.Value.Unit == Unit.Pixels)
        {
            // Subtract all Y coordinates from the height of the plot
            // area canvas to invert the Y axis.  The ensures that
            // larger values appear higher than smaller ones.
            var highPixelValue = PlotArea.ActualHeight - nullableHighCoordinateUnitValue.Value.Value;
            var lowPixelValue = PlotArea.ActualHeight - nullableLowCoordinateUnitValue.Value.Value;
            var closePixelValue = PlotArea.ActualHeight - nullableCloseCoordinateUnitValue.Value.Value;

            var dataPointHeight = lowPixelValue - highPixelValue;
            var closeCoordinate = closePixelValue - highPixelValue;
            dataPoint.CloseCoordinate = closeCoordinate;
            dataPoint.Height = dataPointHeight;

            // center our stock data point on the X point
            Canvas.SetLeft(dataPoint, dateCoordinateUnitValue.Value.Value - (dataPoint.ActualWidth / 2.0));
            Canvas.SetTop(dataPoint, highPixelValue);
        }
    }
The GetPlotAreaCoordinate method of the IAxis type is important to understand. Rather than a double this method returns a nullable UnitValue object. This value is nullable because a given value may not exist on an axis. For example negative values cannot exist on a logarithmic axis. Also certain values may or may not be present on a category axis.
The UnitValue object is composed of a double Value property and an enum Unit property value which can be either Pixels or Degrees. Although there aren't current any axes in Silverlight Charts that return Degree values this may change in the future to support radial axes. For the time being our series will only render pixel values.
Now we're ready to implement our AxisInvalidated method. All we need to do is call UpdateDataPoints!
public void AxisInvalidated(IAxis axis)
{
    //Refresh();
    UpdateDataPoints(_dataPoints.Values);
}
Given the following XAML...
        <charting:Chart x:Name="chart">
            <charting:Chart.Axes>
                <charting:DateTimeAxis Orientation="X" />
                <charting:LinearAxis Orientation="Y" />
            </charting:Chart.Axes>
            <local:StockSeries Title="My First Series" />
        </charting:Chart>
...we should be able to see our series. Drumroll please...

Oops. So what went wrong? Why didn't our data points get plotted?
In fact our data points were plotted, it's just that they are outside of the visible range of the Y axis. Notice that the range on the Y axis is 0 to 1. Turns out that just as an axis needs to communicate with a series when it changes, a series must also communicate information to its axes. In this case the series must communicate its data range to the axes so that the axes can select an appropriate range.
Helping the Axis Pick a Better Range
In order to get the axis to choose a range that is appropriate for our data we'll implement IRangeProvider. Let's take a look at how an IRangeProvider interacts with an IRangeAxis.

We implement the IRangeProvider.GetRange method so the axis can query the series to determine an appropriate range to display. When a range consumer requests a range it passes itself to the GetRange method. This allows us to determine which axis is requesting the range, the dependent axis or the independent axis.
    public class StockSeries : Series, IRequireGlobalSeriesIndex, IAxisListener, IRangeProvider
    {
        //snip...

        public Range<IComparable> GetRange(IRangeConsumer rangeConsumer)
        {
            if (_dataPoints.Any())
            {
                if (rangeConsumer == IndependentAxis)
                {
                    DateTime minimum = _dataPoints.Values.Select(dataPoint => dataPoint.Date).Min();
                    DateTime maximum = _dataPoints.Values.Select(dataPoint => dataPoint.Date).Max();
                    return new Range<IComparable>(minimum, maximum);
                }
                else if (rangeConsumer == DependentAxis)
                {
                    double minimum = _dataPoints.Values.Select(dataPoint => dataPoint.Low).Min();
                    double maximum = _dataPoints.Values.Select(dataPoint => dataPoint.High).Max();
                    return new Range<IComparable>(minimum, maximum);
                }
            }
            return new Range<IComparable>();
        }

    }
Now the range axis can determine the best range to use to display our series data. That's only half of the equation though. The series also needs to be able to inform the axis that its range has changed. The best time to do this is in the Refresh method after we load our data.
public override void Refresh()
{
    if (IndependentAxis != null && DependentAxis != null && PlotArea != null && ItemsSource != null)
    {
        // snip...

        this.Dispatcher.BeginInvoke(
            () =>
            {
                UpdateDataPoints(_dataPoints.Values);
                {
                    {
                        IRangeConsumer rangeConsumer = IndependentAxis as IRangeConsumer;
                        if (rangeConsumer != null)
                        {
                            rangeConsumer.RangeChanged(this, GetRange(rangeConsumer));
                        }
                    }
                    {
                        IRangeConsumer rangeConsumer = DependentAxis as IRangeConsumer;
                        if (rangeConsumer != null)
                        {
                            rangeConsumer.RangeChanged(this, GetRange(rangeConsumer));
                        }
                    }
                }
            });
    }
}
Now we should be able to see our series in action...

Hmmm, looks okay. Our data points have got a nice looking gradient and they've been plotted properly.
The problem is that our far left and far right data points stretch outside of the chart. The axis is doing its job and picking a range that encompasses all our data. The problem is that our data points have a display width in addition to a data value.
What we'd really like is for the axis to pick a range large enough so that both our data and our visual objects will fit inside of the series. So how do we do that?
Making Room With ValueMargins
In order to help an axis balance display concerns and data concerns Silverlight Charts provides a ValueMargin object. A value margin is a data value with a high and low margin value in pixels. When an axis is provided with value margins in addition to a range it will try and find a range large enough such that a series data and its graphical objects can be displayed inside of the Chart.
The IValueMarginProvider and IValueMarginConsumer interfaces work in a way very similar to the IRangeProvider and IRangeConsumer interfaces:

Let's implement IValueMarginProvider.
    public class StockSeries : Series, IRequireGlobalSeriesIndex, IAxisListener, IRangeProvider, IValueMarginProvider
    {
        //snip...

        public IEnumerable<ValueMargin> GetValueMargins(IValueMarginConsumer consumer)
        {
            // We only need to worry about value margins on the X axis.
            // On the Y axis the top and bottom of the data point always
            // correspond to the value location on the axis.
            if (consumer == IndependentAxis && consumer is IRangeAxis)
            {
                if (_dataPoints.Values.Any())
                {
                    // We return the width of only minimum and maximum data
                    // points.  The other information is unnecessary.
                    StockDataPoint minimumStockDataPoint = EnumerableFunctions.Min(_dataPoints.Values, dataPoint => dataPoint.Date);
                    StockDataPoint maximumStockDataPoint = EnumerableFunctions.Max(_dataPoints.Values, dataPoint => dataPoint.Date);
                    var halfWidth = minimumStockDataPoint.Width / 2.0;
                    return new[]
                    {
                        new ValueMargin(minimumStockDataPoint.Date, halfWidth, halfWidth),
                        new ValueMargin(maximumStockDataPoint.Date, halfWidth, halfWidth),
                    };

                }
            }
            return new ValueMargin[] { };
        }
    }
Notice that we're only worried about returning value margins to the independent (X) axis. That's because the top and bottom of a data point on a stock chart always line up with a value on the axis (lest they be misleading).
To make life easier I've written some helper functions: Min and Max. These functions work by accepting a function that they apply to each data point. The function returns a value which is used to compare the data points. The data point with the largest or smallest computed value is returned.
That wasn't too tough. Now let's take a look at our series...
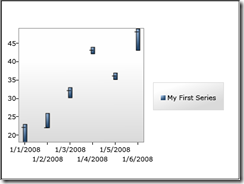
Success! There's only one more thing to do...
Supporting a Category Axis
Remember that we accept any axis on the horizontal, not just a DateTimeAxis. This means that we can use an instance of the CategoryAxis class for our independent axis. A category axis is similar to a range axis in that it needs to know what values to include. As a result our series must inform the category axis which discrete values it intends to plot. Predictably this is accomplished using the familiar Provider/Consumer model.
Let's implement IDataProvider...
    public class StockSeries :
        Series, IRequireGlobalSeriesIndex, IAxisListener, IRangeProvider, IValueMarginProvider, IDataProvider
    {
        public IEnumerable<object> GetData(IDataConsumer axis)
        {
            if (axis == IndependentAxis)
            {
                return _dataPoints.Values.Select(dataPoint => dataPoint.Date).Cast<object>();
            }
            else if (axis == DependentAxis)
            {
                return
                    _dataPoints.Values
                        .SelectMany(dataPoint => new[] { dataPoint.Close, dataPoint.High, dataPoint.Low }).Cast<object>();
            }
            return new object[] { };
        }
        //snip...
    }
Just as we must inform the range axes we're using that the range has changed after loading new data we must also inform any axes that implement IDataConsumer (such as axes that implement ICategoryAxis) that our data has changed. Let's revisit our Refresh method one last time.
        public override void Refresh()
        {
            // snip...
            this.Dispatcher.BeginInvoke(
                () =>
                {
                    UpdateDataPoints(_dataPoints.Values);
                    {
                        {
                            IRangeConsumer rangeConsumer = IndependentAxis as IRangeConsumer;
                            if (rangeConsumer != null)
                            {
                                rangeConsumer.RangeChanged(this, GetRange(rangeConsumer));
                            }
                            IDataConsumer dataConsumer = IndependentAxis as IDataConsumer;
                            if (dataConsumer != null)
                            {
                                dataConsumer.DataChanged(this, GetData(dataConsumer));
                            }
                        }
                        {
                            IRangeConsumer rangeConsumer = DependentAxis as IRangeConsumer;
                            if (rangeConsumer != null)
                            {
                                rangeConsumer.RangeChanged(this, GetRange(rangeConsumer));
                            }
                            IDataConsumer dataConsumer = DependentAxis as IDataConsumer;
                            if (dataConsumer != null)
                            {
                                dataConsumer.DataChanged(this, GetData(dataConsumer));
                            }
                        }
                    }
                });
        }
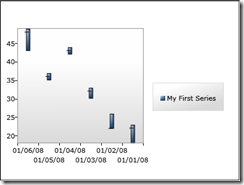
Now let's try and use a category axis with our stock series. To make things interesting let's reverse the order of the dates on the axis (something a DateTimeAxis doesn't support).
<charting:Chart x:Name="chart">
    <charting:Chart.Axes>
        <charting:CategoryAxis Orientation="X" SortOrder="Descending">
            <charting:CategoryAxis.AxisLabelStyle>
                <Style TargetType="charting:AxisLabel">
                    <Setter Property="StringFormat" Value="{}{0:MM/dd/yy}" />
                </Style>
            </charting:CategoryAxis.AxisLabelStyle>
        </charting:CategoryAxis>
        <charting:LinearAxis Orientation="Y" />
    </charting:Chart.Axes>
    <local:StockSeries Title="My First Series" />
</charting:Chart>
Now let's take a look at our Series...
A New Series For Silverlight Charts
As you can see Silverlight Charts has a very rich set of interfaces you can use to smoothly integrate custom series and axes. With roughly 450 lines of code we just added the last series missing from Excel to Silverlight Charts. The ball's in your court. We're eager to see what the community comes up with.
Next Time: Making our Stock Series dynamic!